One general tip before going into the details, customizing graphs and charts in Microsoft Publisher is probably your best option because it provides a multitude of features that allow for customization of virtually every aspect of your graph or chart.
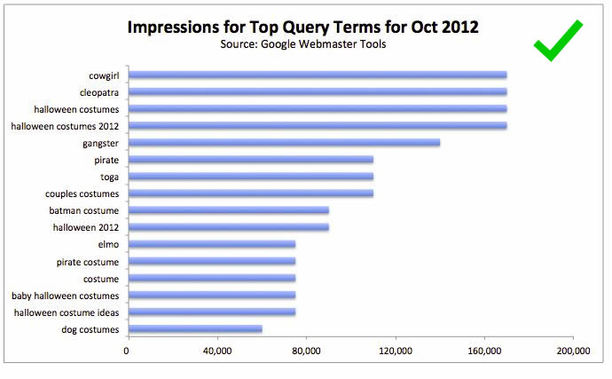
1. Succinct and Descriptive Graph Title
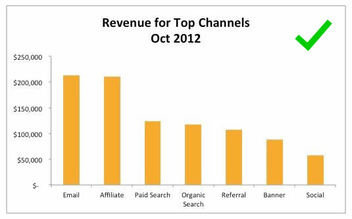
The first thing someone will see when looking at a graph on your poster is the title. So having a descriptive title that encompasses the subject matter of the data will help the viewer frame the information you are presenting. A good title allows your audience to read, digest, and compartmentalize the information faster. Below are some examples of good titles.
 |  |  |
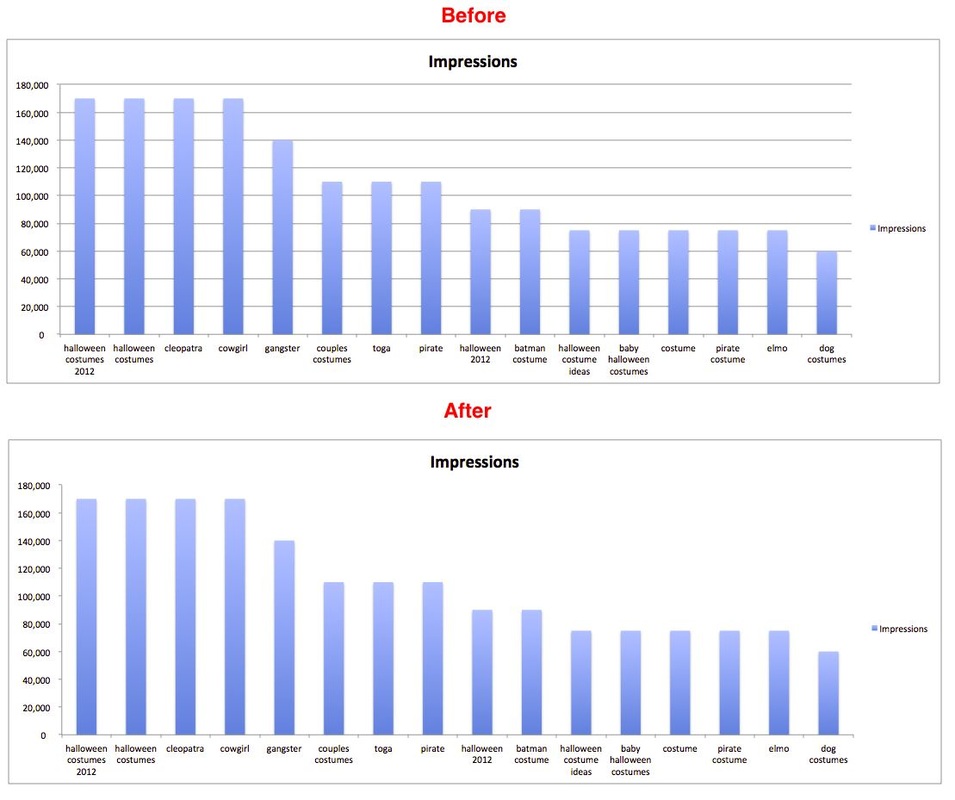
2. Sort Your Data BEFORE Charting
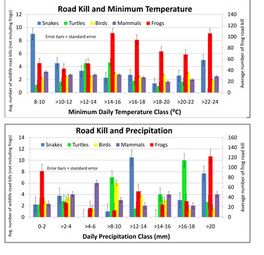
If your independent variable is 'time' then a chronological order makes obvious sense. However, if this isn’t the case, ordering your variables in descending order might make more sense rather than random placement.
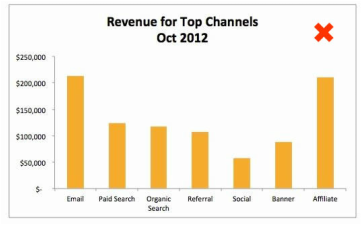 |  |
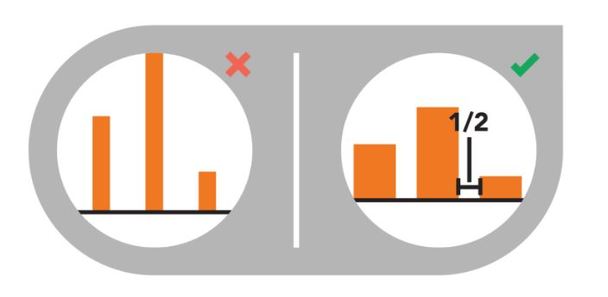
3. Spacing Between Bars
To make your graphs easier to read, leave a white space between your bars to help viewers quickly distinguish between variables and to help them compare across non-adjacent variables more easily. One great rule of thumb to follow is the 1:2 rule: the white space between bars should be half as wide as the bars themselves.
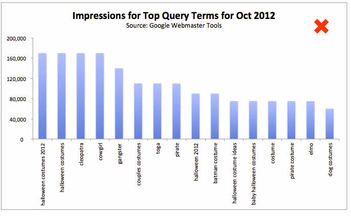
4. Clean Up the Axes
Typically, the independent variable goes on the x-axis and the dependent variable on the y-axis. This is a great general rule to follow, but when it comes to visual communication, sometimes traditional conventions need to be broken in order to achieve the ultimate goal of effective communication.
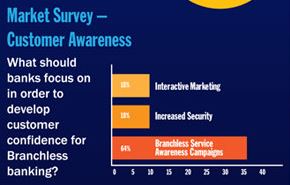
Vertical or slanted text on a poster forces viewers to tilt their heads in a usually uncomfortable manner in order to read your graph. An easy way to avoid this is to switch axes like the example below.
Vertical or slanted text on a poster forces viewers to tilt their heads in a usually uncomfortable manner in order to read your graph. An easy way to avoid this is to switch axes like the example below.
 | 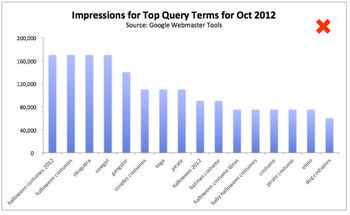 |
Remember, always try to label your axes, especially if the variables are numbers. Visual symbols like the dollar sign $ or % work well in this case.
5. Modify Grid lines and Background Color
To make your graph and poster visually attractive it is essential to make sure that the colors flow. Try to ensure that the eye is not distracted by objects that are not crucial. In order to match the color of your graphs with your poster's color scheme, it is important to customize the graph using tools in Microsoft Publisher. Incorporating the same color scheme will help your poster flow, avoiding distractions from other important features information.
Microsoft Publisher allows you to modify all of these aspects of your graph. First the background default is usually set to showing grid lines behind the bars. In most cases you would want to remove these.
Microsoft Publisher allows you to modify all of these aspects of your graph. First the background default is usually set to showing grid lines behind the bars. In most cases you would want to remove these.
Another part of the background is the actual color fill. You may be working on a poster with a colored background that isn't white. So when you place a graph with a white background it shows up as a white block on the poster making it stick out noticeably even though it may not even be that important to the poster's overall message. To avoid this make the background of the graph transparent by selecting "No fill". You will notice that the colored background of your poster is now the background of your graph since its transparent making it fit much nicer with the rest of the poster and not stick out as much.


 RSS Feed